
Data analytics, which is also known as data analysis refers to quantitative as well as qualitative techniques that are used to uplift the productivity and gain business insights. Data analytics technologies are widely used in the commercial industries to enable organizations to make significant business decisions.
Now coming to R language, it is extremely flexible open source programming language and environment which is freely available for all mainstream operating systems. R is used widely and supported by the R Foundation for the Statistical Computing.
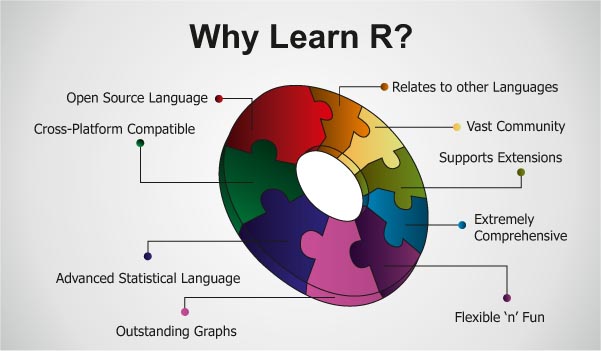
Why use R Language for Data Analytics?
There are various reasons to do data analytics using R languages, which are as follows:
- Usage and Task
It is used when the data analysis tasks need independent computing or analysis on the individual servers.
It is much easier for the neophytes, for the analytic work. Also, statistical models can be written in some line of code. The style of coding is very simple in R.
- Data Handling Capabilities
R is handy as it has the availability of immediate access to over 7800 packages that are customized for several computation tasks.
It is usable for fundamental data analysis without the installation of packages. Further, big datasets require the use of some packages like dplyr, data.table and though.
- Support
For data analysis with R, there’s a lot of support, which are: Rdocumentation (the R documentation aggregator), stackoverflow and R-help mailing list.
Features of R Language
- Usability
Statistical models can be written with few lines only. Further, there are R stylesheets, but everyone does not use them. In R, the same kind of functionality can be written in different ways.
- Community
There is a big community with support coming in different forms like user-contributed documentation, mailing lists, and active stackoverflow members. Also, there is more adoption from statisticians, data scientists, researchers, and quants. It boasts a vibrant online community.
- Flexibility
It is quite easy to use very complex formulas in R. Even, all types of models along with statistical test are readily available and easily used.
- Ease of Learning
At starting, it has a steep learning curve and once you get to know the basics perfectly, you can quickly grab advanced stuff. It is not at all hard for experienced programmers.
The Bottom Line
There are many big names which are making R to work for them, such as Facebook, Twitter, New York Times, Bank of America, etc. R has a vast library of statistical techniques, which makes it a powerful language. Its packages cover everything from Psychometrics to Genetics to Finance. R is great for prototyping and has an edge in data visualization. It focuses on user friendly data analysis, graphical models and statistics. The packages like ggplot2 make plotting easy and customizable, reshpape2 does data restructuring. At last, R makes life easier to reproduce or share the work and present it on different forms, with embedded graphs, text and so on.